


Are you paying too much for Facebook ads? Wondering which metrics are best to help you analyze your ad performance?
In this article, you’ll explore three key metrics to analyze Facebook ad costs and discover benchmarks to assess these performance stats. You’ll also learn what to adjust if your stats don’t meet the benchmark performance rates.
To learn about three key Facebook ad metrics, read the article below for an easy-to-follow walkthrough or watch this video:
#1: CTR (Link Click-Through Rate)
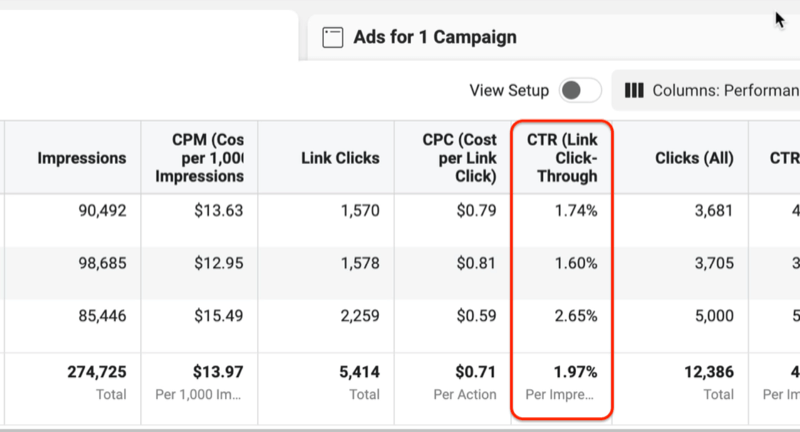
The CTR (link click-through rate) metric is the percentage of people who saw your Facebook ad and clicked over to your offer, landing page, website, and so on. You want this number to be 1% or higher. Otherwise, you’re probably leaving money on the table.
You can view this metric in your Facebook Ads Manager dashboard. Go to facebook.com/adsmanager and find the column titled CTR (Link Click-Through Rate).
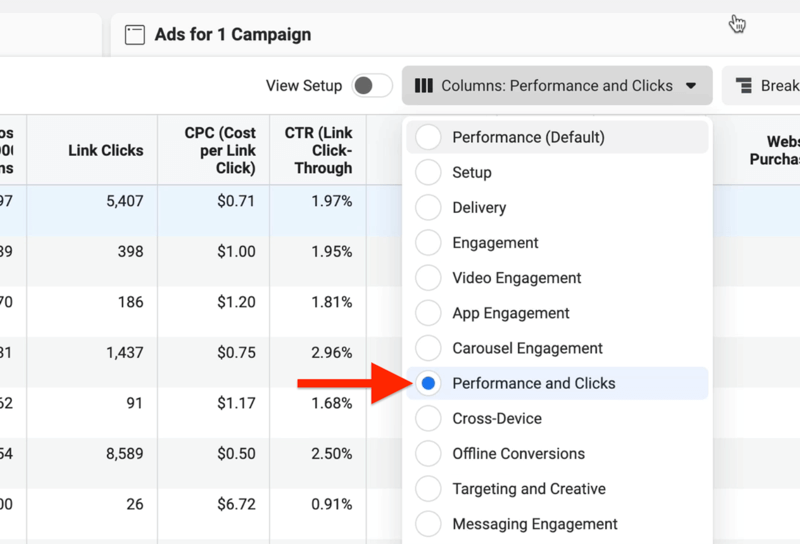
If you don’t see this column on your dashboard, click on the Columns drop-down menu and choose Performance and Clicks.
A word of caution: Make sure you’re looking at your CTR (link click-through rate), not your CTR (all). CTR (all) represents anybody who clicked on any part of your ad over to your Facebook page. You just want to track the people who clicked on your offer.!
If your CTR (link click-through rate) is lower than the 1% benchmark, you need to go back to testing your Facebook ads. If you haven’t tested, this is a huge opportunity to make your ads more effective. Improve your visuals so more people are likely to see your ad and click over to your offer.
#2: CPM (Cost per 1,000 Impressions)
The second key Facebook ad metric to track is CPM (cost per 1,000 impressions). This stat is a little more controversial but I stand by this: If your CPM is above $42, Facebook doesn’t like something in your ads or on your landing page.
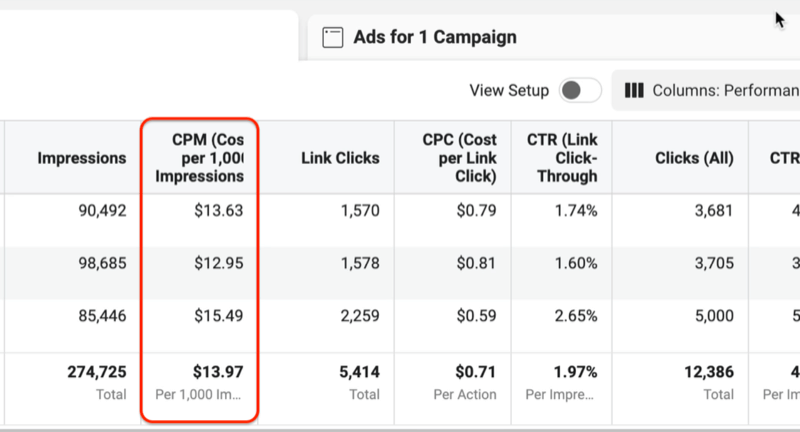
The caveat would be if your CPM is above $42 and you’re working with retargeting audiences or really small audiences. In these cases, it might be a little higher than $42.
But if you’re targeting cold audiences and the CPM is higher than $42, you need to look closely at your ad copy and landing page to find the culprit. Something in your copy, imagery, or landing page is causing Facebook to not love your ads. You need to correct that so your ads don’t cost more than they should.
#3: Landing Page Conversion Percentage
The third key Facebook ad metric you want to track is your landing page conversion rate. This metric will vary by industry so you need to do some research to find out what’s considered normal in your particular industry.
For instance, if I’m collecting email addresses for free online training, guide, or checklist, I want my landing page to convert at above 30%. If I’m sending traffic to an eCommerce store and a specific sales page, I’m looking for a 1% to 3% conversion rate on that sales page at a minimum.
The easiest way to find out how well your landing page is performing for you is to go to your landing page software, eCommerce store, or website software and just look at the backend. Most of these tools will calculate the percentages for you.
If you want to calculate your landing page conversion rate manually, take your conversion number and divide it by your landing page views. Then multiply that number by 100 to get your landing page conversion percentage.
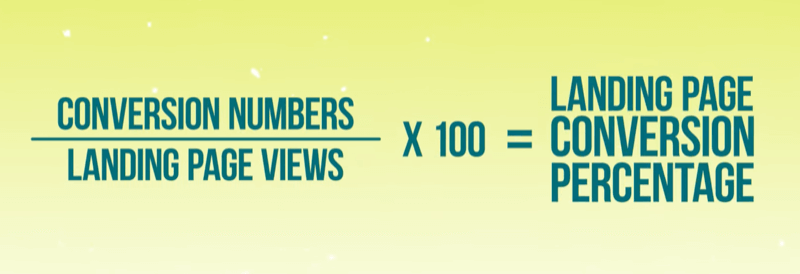
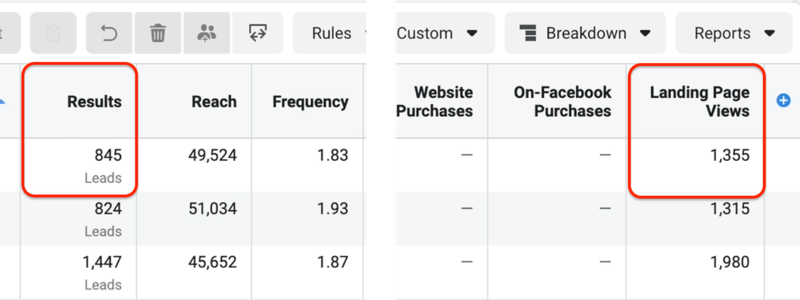
In the example below, you would take 845 leads and divide that by 1,355 landing page views. When you multiply that number by 100, you get a 62% landing page conversion percentage.
The numbers above are on the high side because I tested and optimized those ads. But if your ads are newer to the platform or haven’t gone through rigorous testing, they might not be there yet.
If your landing page isn’t converting at the minimum benchmarks for your industry, you need to do some landing page testing. Work on improving your messaging and possibly your offer. When you conduct landing page experiments, make sure you do them one at a time so you’ll be able to tell what’s improving your landing page and what’s not.
Conclusion
Do you ever feel like you’re throwing spaghetti at the wall with your Facebook ad campaigns? To get more control over the success of your ads, you need to look at three key metrics: CTR (link click-through rate), CPM, and landing page conversion rate. If your stats don’t meet the benchmark performance rates, you’ll need to look closely at your ad copy, imagery, landing page, and possibly messaging and do some testing.
What do you think? Will you take a closer look at these three metrics for your Facebook campaigns? Share your thoughts in the comments below.
Zirker, T. (2021) Facebook Ads Analytics: How to Stop Wasting Money, Social Media Examiner | Social Media Marketing. Available at: https://www.socialmediaexaminer.com/facebook-ads-analytics-how-to-stop-wasting-money/.


0 Comments